

Policy Recommendations
- Macroeconomic imbalance procedures should consider developments in the nontradable sector such as real estate, because the shift of productivity gains towards the nontradable sector can be a common precursor of a deep, economic crisis.
- Long-run policies should focus on capacity for structural change, since the current sector composition of many countries in the Periphery impedes growth.
- Continuous efforts should be taken in order to improve domestic institutions, such as the quality of the public administration, infrastructure or the legal system.
Abstract
While all EU economies witnessed a sharp decline in output during the financial crisis, the peripheral EU countries were particularly hard hit. This is surprising, given their sound macroeconomic performance prior to the crisis. It became obvious that imbalances had been building up underneath a seemingly tranquil macroeconomic surface. We argue that the underlying mechanisms are mirrored by productivity developments in a tradable-nontradable framework. Countries that were severely affected not only exhibited low productivity growth in tradables (e.g. manufacturing), but also experienced a sharp increase in the production of nontradables (e.g. real estate) before the crisis.
****************************
What can we learn from productivity dynamics over the crisis episode in the EU?
Introduction
A remarkable aspect of the global financial crisis is the force with which it hit EU countries. Many European economies succumbed simultaneously, which suggests that international factors played a role in the onset of the crisis. Some EU countries were hit harder than others, pointing at the role of domestic factors. Hence the crisis highlighted the consequences of the divergent growth trajectories of EU countries prior to the crisis.[i]
[zitat inhalt=”Economic convergence has traditionally been measured by GDP per capita, an indicator of aggregate developments that ignores many aspects.”]
Economic convergence has traditionally been measured by GDP per capita, an indicator of aggregate developments that ignores many aspects; for instance, it cannot capture the extent to which sectoral imbalances can build up underneath a seemingly tranquil macroeconomic surface, as witnessed by peripheral EU countries prior to the crisis.[ii] Against this background, we assess the macroeconomic performance of the EU member states on a more disaggregated level. In particular we focus on the supply side, drawing on a two-sector model – the tradable‑nontradable framework (T‑NT).[iii]
At the core of the T‑NT framework is the distinction between tradable and nontradable goods and services (short: tradables and nontradables).[iv] Nontradables can, by definition, only be consumed in the economy in which they are produced; they cannot be exported or imported (e.g. construction or personal services). In turn, tradables can be exchanged internationally at reasonable transport cost (e.g. manufactured goods or agricultural products).
Figure 1 shows the corresponding path of nontradables production as a share of GDP for three country groups:
(1) “Core” EU countries, (2) “Periphery” EU countries, and (3) “CEE” EU countries. The figure describes the output composition with respect to nontradables and tradables as an indicator of imbalances on the supply side.The boom in the ‘Periphery’ EU countries prior to the outbreak of the global financial crisis is associated with a significant increase in the production of nontradables relative to tradables.
The boom in the “Periphery” EU countries prior to the outbreak of the global financial crisis is associated with a significant increase in the production of nontradables relative to tradables. The correction of the unsustainable output composition in these countries during the financial crisis was characterised by a remarkable reallocation of resources: labour and capital were moved from the nontradable goods sector to the tradable goods sector, which was accompanied by a sharp decline in the production of nontradables. Dis-investment and a temporary spike in unemployment were a consequence of this adjustment process.
In contrast, the change in the share of nontradables was negligibly small in the “Core” economies and remained fairly constant throughout the global financial crisis. The higher share of tradables production in the “Core” economies gives rise to a greater export potential, and therefore this country group hardly faced structural impediments to growth once global demand conditions improved.
In the “CEE” countries, the evolution of nontradables is inherently different to the other two country groups. This can be pinned down to two factors: First, the share of nontradable goods production is comparably low in these countries. Secondly, the share of nontradable goods production has been trending downwards. The mirror picture of the low and declining share of nontradable goods production in the “CEE” countries is that the tradable goods sector’s share is high and increasing. This in turn highlights the – on average – high export shares of the “CEE” countries.
The productivity gap
Two sector models typically assume a more and a less productive sector, which gives rise to a productivity gap. The growth literature has identified a non-linear relationship between the productivity gap and economic development. As countries grow, the gap first widens as the more productive sector (here: tradables) increasingly outperforms the less productive sector (here: nontradables). Eventually, the gap becomes smaller once a certain development stage has been reached, i.e. the productivity levels of tradables and nontradables converge (McMillan et al., 2014).
We empirically implement these considerations, and use Eurostat data on value added and hours worked to construct a measure for labour productivity[vi] for all EU Member States. We reach the following conclusions:
- Productivity of tradables is, on average across all countries and years, 19 percent higher than the one of nontradables.
- The higher the economy wide level of productivity, the higher the productivity gap between tradables and nontradables becomes in our EU‑wide sample.
- The contribution of tradables outweighs the one of nontradables in shaping aggregate productivity.
- A shift of sector structures towards tradables fosters convergence in the EU.[vii]
Achieving structural change in favour of tradables is therefore desirable, especially for less productive economies.
Achieving structural change in favour of tradables is therefore desirable, especially for less productive economies. A shift towards low productive activities (i.e. the nontradable sector) is likely to be growth reducing.
We find no evidence for a catching‑up process across the country groups.
These thoughts are reflected in an EU and crisis context. We find no evidence for a catching‑up process across the country groups. The most productive countries exhibit the highest productivity growth rates. This suggests that the “convergence engine” has come to a halt.
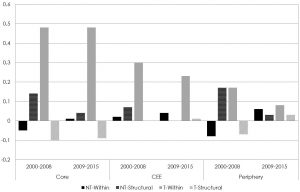
In a second step, we decompose the annualised, aggregate productivity growth rates into a (i) structural and (ii) a within-sector component. The structural component captures the contribution to aggregate productivity arising from changes in the sectoral composition of production. The within-sector contribution in turn is an indicator for productivity upgrading within existing structures. In addition, we analyse the period before (2000-2008) and after (2009-2015) the financial crisis.
This implies that the structural component became almost negligible after the Great Recession.
The results show that in the pre-crisis period, more than three quarters of the increases in labour productivity could be attributed to the within sector effect. In the post-crisis period this share increased to more than 90 percent. This implies that the structural component became almost negligible after the Great Recession. The data also reveal different patterns across country groups:
- In the Core and CEE countries, the within productivity growth contributions of tradables dominate aggregate growth. In other words, productivity growth was driven by the upgrading of given structures within the tradables sector. Even though productivity growth declined after the crisis, this pattern continued.
- In the Periphery, the modest labour productivity growth of the pre-crisis period came from a structural shift towards nontradables (e.g., construction, real estate). In the re-balancing phase after 2008, aggregate productivity growth remained at the same level. The contribution from the structural component dropped, and was compensated by within productivity growth of tradables.
Figure 1: Illustration of productivity growth contributions across country groups, periods and sectors
To further illustrate these results, we compare countries assigned to the three groups: Germany (Core), Greece (Periphery) and Poland (CEE). Before the crisis, Germany’s annualised productivity growth was the highest among the three comparison countries, followed by Greece and Poland, for which data are only available from 2003 onwards. Productivity growth after the financial crisis declined slightly in Germany, but remained strong. Productivity growth even accelerated in Poland, albeit Poland’s growth rates remain significantly below those of Germany. Even though productivity growth was positive in Greece before the crisis, it turned negative after 2008/2009 (see Table 1).
Table 1: Productivity growth contributions across three countries and sectors before and after the crisis
|
Pre crisis (2000 – 2008) |
Post crisis (2009 – 2015) | ||||||
| Country | T-NT | Within | Structural | Total | Within | Structural | Total |
| Germany | Nontradable | 0.13 | -0.03 | 0.10 | 0.08 | -0.08 | 0.00 |
| Tradable | 0.42 | 0.02 | 0.44 | 0.46 | 0.03 | 0.48 | |
| Total | 0.55 | -0.01 | 0.54 | 0.54 | -0.06 | 0.48 | |
| Greece | Nontradable | -0.15 | 0.33 | 0.19 | 0.11 | 0.07 | 0.18 |
| Tradable | 0.23 | -0.08 | 0.15 | -0.31 | -0.04 | -0.34 | |
| Total | 0.09 | 0.25 | 0.34 | -0.19 | 0.03 | -0.16 | |
| Poland | Nontradable | 0.00 | 0.00 | 0.01 | 0.07 | 0.00 | 0.07 |
| Tradable | 0.11 | 0.06 | 0.17 | 0.21 | 0.03 | 0.23 | |
| Total | 0.12 | 0.06 | 0.17 | 0.28 | 0.02 | 0.30 | |
This leads to the question concerning the composition of productivity growth. Germany’s sound aggregate growth rates mainly originated from within‑contributions of the sector that is producing tradable goods and services. Poland’s productivity growth roughly follows the same pattern, although at a lower pace than in Germany. By and large, the financial crisis did not affect this composition of growth.
However, the picture is fundamentally different in Greece. Before the crisis, labour productivity growth was driven by a structural shift towards nontradables. After the crisis, a growth impulse from a shift towards nontradables remained, but aggregate productivity growth figures were substantially reduced by negative within‑sector contributions of the tradable sector.
Policy Recommendations
These results allow suggesting a series of recommendations for economic policy makers.
First, the productivity growth patterns provide important insights into how crises build up. The shift of productivity gains towards the nontradable sector was a precursor of a deep crisis.[viii] In other words, the T-NT approach has the potential to identify an unsustainable sectoral composition of growth underneath a seemingly tranquil macroeconomic surface. Hence, the European Commission’s macroeconomic imbalance procedures should consider such developments in its crisis‑warning system.
Second, we document the role of sectoral structures in aggregate productivity growth, which – at least partly – explains the lack in convergence of productivity growth rates across EU countries. This emphasises the role for long-run policies with a focus on structural change. This should become a priority in the EU, since the current sector composition of many Periphery countries is found to impede growth.
Third, the observed asymmetries in productivity growth evoke the question about the factors that shape these discrepancies at the country level. In this context, we identify a growth enhancing effect of the quality of institutions (especially rule of law, sound infrastructure and a sound public administration) on productivity growth.[ix] Hence, we corroborate the call for institutional reform at the country level.
[i] This research was financed by the European Commission, DG GROW (Framework Service Contract No. ENTR/300/PP/2013/FC-WIFO) under the project „Competitiveness drivers and obstacles, intra-EU linkages and European value chains in GVCs”. The findings, interpretations, and conclusions expressed in this paper are entirely those of the authors and do not necessarily represent the views of the European Commission.
[ii] Imbalances refer to potentially harmful developments that could adversely affect macroeconomic stability in a particular EU country or the EU as a whole. These comprise aspects such as a pronounced savings-investment gap, a real estate bubble, etc.
[iii] Sachs, J., and Larraine, F. B. (1993). Chapter 21: Tradable and Nontradable Goods. In Macroeconomics in the Global Economy. Prentice Hall.
[iv] This versatile tool of macroeconomic modelling describes a mechanism in which a shift from a current account deficit to a current account surplus involves a shift in the composition of domestic production structures. The presence of nontradable goods affects the economy along a multitude of dimensions, ranging from productivity, price determination, export potential and current account balances to the effects of macroeconomic policy.
The “Core” economies include Austria, Germany, France, the UK, the Benelux countries (Belgium, the Netherlands and Luxembourg) and the Scandinavian countries (Denmark, Sweden and Finland). The countries of the group “Periphery” are comprised as follows: Greece, Italy, Cyprus, Ireland, Portugal, Matla and Spain. And finally the “CEE” countries are the Eastern, and Central Eastern European countries: Bulgaria, Croatia, Czech Republic, Estonia, Latvia, Lithuania, Hungary, Poland, Romania, Slovenia, and Slovakia.
[vi] In the remainder we simply refer to productivity instead of labour productivity.
[vii] Herrendorf, Berthold, Richard Rogerson, and Akos Valentinyi. “Two perspectives on preferences and structural transformation.” American Economic Review 103.7 (2013): 2752-89.
[viii] Interestingly, the build-up of imbalances in the run-up to the Latin American debt crisis of the 1980s was very similar to the European case in the 2000s.
[ix] Ciccone, A., and Papaioannou, E. (2009). Human capital, the structure of production, and growth. The Review of Economics and Statistics, 91(1), 66–82.
About the article
ISSN 2305-2635
The views expressed in this publication are those of the authors and not necessarily those of the Austrian Society of European Politics or the organisation for which the authors work.
Key words
crisis, productivity, structural change
Citation
Friesenbichler, K., Glocker, C. (2018). What can we learn from productivity dynamics over the crisis episode in the EU? Wien. ÖGfE Policy Brief, 07’2018

